Google Analytics integrated advanced dashboard
This plugin provides shop owners with important statistics in one place for a better overview of the shop's performance. This plugin will be updated with more features
Key Features
- Advanced dashboard with more statistical data to make better decisions
- Easy analysis of marketing campaign results
- Provides an option to view abandoned cart details on the dashboard
- Filter based on sales and number of orders
- Provision to display Google Analytics information.
About the Extension
Features
- Traffic analysis data from Google Analytics
- Country-specific session data
- Data on time spent on landing pages
- Insights for new customer acquisition
- Country-specific order statistics
- Order statistics by gender
- Data on top products and customers
- Information about the best selling season
- Conversion rate based on Google Analytics
Description
This plugin provides store owners with key performance metrics directly inside the Shopware dashboard—no need to log in to Google Analytics. It delivers a comprehensive overview of your store’s performance in one place.
1. Statistics
Displays data such as:
- Number of orders received within a selected period
- Items sold
- New customers acquired
- Invoice amount
- Average order value
- Refund amount
- Number of canceled orders (last 30 days)
- Visitors
- Conversion rate (total visitors / total orders)
You can also show visitor count and conversion rate directly from Google Analytics by configuring the refresh token and View ID/Property ID (see installation guide for details). Data can be filtered by time interval.
Note: Displaying abandoned cart values requires our Shopware Abandoned Cart plugin, which we highly recommend for boosting conversions.
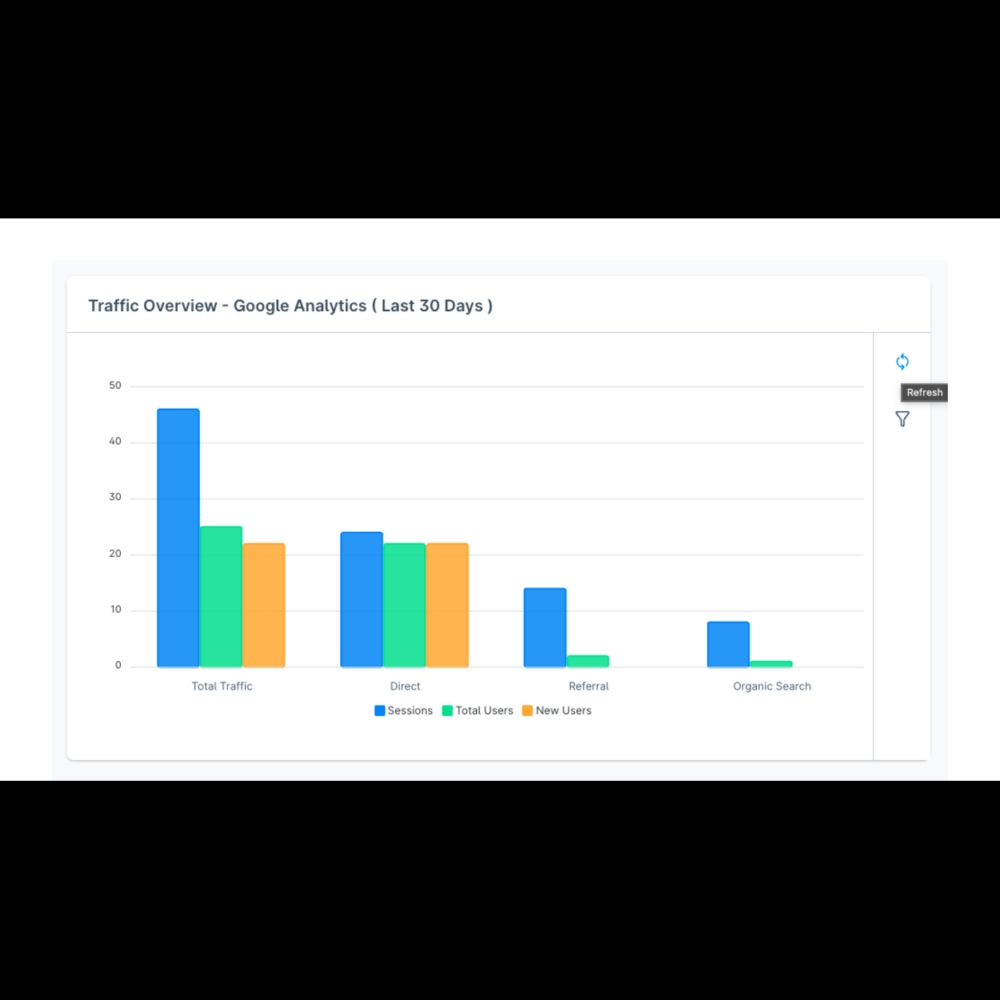
2. Traffic Overview
View sessions, total users, and new users from different traffic sources (via Google Analytics). Data can be filtered by time intervals.
3. Country-Specific Sessions
Displays session data per country from Google Analytics, with filtering by time range.
4. Landing Page Engagement
Shows page views and average time spent on landing pages. Data provided by Google Analytics and filterable by time range.
5. Sales Overview
View sales data for the last 30 days or custom intervals. Filter and display sales by revenue and order count.
6. Top Products
Displays most purchased products with a graphical representation.
7. Top Customers
Lists customers with the highest spending during the selected period.
8. Orders by Country
Graphical display of order counts by country.
9. Highest Order Value Periods
Shows total number of orders grouped by date, month, and year.
10. Gender
Displays order distribution by gender in a pie chart.
Future updates
Additional Google Analytics-based features will be added in future versions. Have a feature request? Let us know at [email protected].


Ready to Elevate Your Online Store?
Let 2Hats Help You!