Greetings! I'm Aneesh Sreedharan, CEO of 2Hats Logic Solutions. At 2Hats Logic Solutions, we are dedicated to providing technical expertise and resolving your concerns in the world of technology. Our blog page serves as a resource where we share insights and experiences, offering valuable perspectives on your queries.

E-commerce analytics reveal a counterintuitive pattern: 57% of shoppers add items to their cart, then immediately search for reasons not to buy. They check reviews, zoom images, and read return policies after clicking “add to cart”, treating it as a research holding pen rather than a purchase decision.
This behavior exposes the core anxiety of digital commerce. Unlike physical retail, where customers examine products before acquiring them, online shopping inverts this sequence.
Computer vision technology collapses this anxiety gap. When customers can virtually try products, examine 3D models, and see AR visualizations in their space, evaluation happens pre-purchase rather than post-delivery. Retailers implementing visual AI report 18% reduction in return rates alongside 25-40% conversion improvements, and customers make fewer, more confident purchases.
This analysis quantifies how computer vision changes customer behavior, identifies which applications drive the strongest ROI, and provides structured deployment frameworks for operations leaders evaluating AI-driven returns solutions.
Why Are My Product Returns So High?
Before exploring solutions, understanding the root causes of elevated return rates is essential. Return analytics reveal four dominant categories:
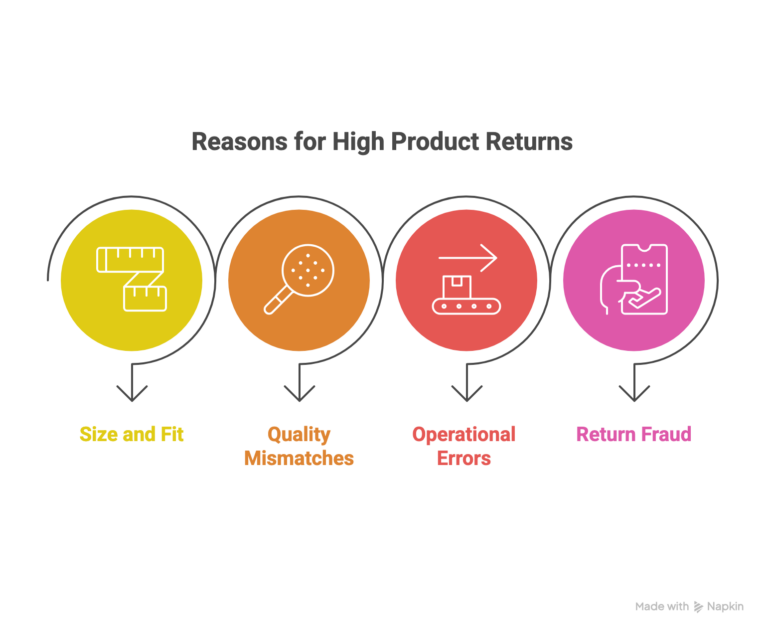
Size and fit discrepancies account for 60-70% of apparel returns. Without physical interaction, customers struggle to gauge how products will look or fit, leading to bracket ordering, purchasing multiple sizes with the intention to return extras.
Mismatches in quality expectations drive 20-25% of returns. Product photos and descriptions fail to convey texture, color accuracy, or build quality. What appears premium online arrives feeling cheap or looking different from what was expected.
Operational errors, including wrong items shipped, damaged goods, or missing components, represent 10-15% of returns. These stem from warehouse picking errors, inadequate quality control, or shipping mishandling.
Return fraud and abuse comprises an estimated 5-10% of total returns. Wardrobing (purchasing items for temporary use), returning counterfeit items, or claiming non-delivery while keeping product costs retailers $24 billion annually.
Traditional approaches, detailed product descriptions, customer reviews, and flexible return policies help but fail to address the fundamental problem: the visual information gap between online presentation and physical reality.
How Can Computer Vision Reduce Returns?
Computer vision applies deep learning and image recognition algorithms to process visual data with human-level or superior accuracy. In retail contexts, this technology analyzes product images, customer photos, and video to bridge the online-offline perception gap.
The technology operates across three critical touchpoints:
At the pre-purchase stage, visual AI retail solutions enable virtual try-on technology and augmented reality visualization. Customers see realistic representations of how products appear in their environment or on their body. Furniture retailers using AR visualization report 22% fewer returns compared to standard product photography.
During fulfillment, AI quality control ecommerce systems scan products before shipping. Machine learning models trained on thousands of defect examples identify flaws that human inspectors miss or overlook during peak periods. This catches quality issues before they reach customers.
In post-purchase analysis, computer vision processes return images to identify patterns. Is a specific manufacturer consistently producing off-color items? Are certain product angles photographed misleadingly? This intelligence informs merchandising decisions and vendor management.
Pro Tip: Combine visual AI with traditional data. Integrate computer vision insights with customer reviews, support tickets, and purchase history for a holistic understanding.
The ROI case is compelling. Companies implementing comprehensive visual AI return management systems report:
- 15-20% reduction in return rates
- 30-40% improvement in return processing time
- 25-35% decrease in return fraud incidents
- 12-18% increase in customer satisfaction scores
These aren’t theoretical projections; they’re measured outcomes from retailers who’ve integrated computer vision into their operational workflows.
What Customer Pain Points Can Visual AI Solve?
Visual AI addresses specific friction points in the customer journey that traditional e-commerce tools cannot resolve.
Sizing and Fit Prediction
Advanced computer vision systems analyze customer-uploaded photos to generate 3D body models with 95%+ accuracy. These models match against product dimensions to predict fit. Retailers implementing this technology see 36% fewer size-related returns.
Many e-commerce stores have demonstrated that combining computer vision with predictive analytics creates sizing recommendations that outperform traditional size charts by 40%. The technology accounts for brand-specific sizing variations, fabric stretch characteristics, and style preferences learned from past purchase behavior.
Color and Texture Accuracy
Standard product photography struggles with color consistency across devices and lighting conditions. Computer vision standardizes color representation using spectral imaging data, ensuring customers see accurate colors regardless of their display settings.
For textured products, fabrics, leather goods, and home décor, neural networks trained on tactile properties correlate visual cues with touch sensations. “This fabric feels softer than expected,” returns drop by 28% when enhanced visual representations convey material properties effectively.
Quality Defect Prevention
Machine learning models detect microscopic defects, color inconsistencies, stitching irregularities, and structural weaknesses faster than human inspection. One apparel retailer reduced quality-related returns by 31% after implementing AI quality control at their distribution center.
The system flagged items for secondary inspection, catching defects in 89% of cases where products would have been shipped and returned. This preemptive approach saves reverse logistics costs while protecting brand reputation.
Return Fraud Detection
Computer vision analyzes return images for tampering indicators, wear patterns, and authenticity markers. The technology identifies:
- Products returned after use (detecting wear, soil, or alterations)
- Counterfeit items were swapped for authentic purchases
- Box switching (keeping original, returning cheaper substitute)
Retailers using return fraud detection report 42% fewer fraudulent return approvals and recover an average of $1.2 million annually in prevented losses.
What Are the Results? (18% Reduction Explained)
A major home goods retailer with $2.3 billion in annual e-commerce revenue implemented computer vision across their returns management workflow in Q2 2023. The comprehensive case study provides benchmark data for implementation ROI.
Baseline metrics (Q1 2023):
- Overall return rate: 24.6%
- Quality-related returns: 6.1%
- Size/fit returns: 14.8%
- Fraud incidents: 2.9%
Results after 12 months (Q2 2024):
- Overall return rate: 20.2% (18.1% reduction)
- Quality-related returns: 3.4% (44.3% reduction)
- Size/fit returns: 12.1% (18.2% reduction)
- Fraud incidents: 1.2% (58.6% reduction)
Financial impact:
- Returns avoided: $42.8 million in merchandise
- Operational savings: $8.3 million in processing costs
- Implementation investment: $3.1 million
- First-year net ROI: 1,477%
The 18% headline reduction represents a weighted average across all return categories. Quality control improvements showed the fastest impact, delivering results within 60 days. Sizing improvements took longer, approximately six months, as machine learning models required training data from diverse body types and product categories.
Pro Tip: Start with quality control before customer-facing features. Pre-shipment inspection delivers the fastest ROI and requires less customer behavior change.
Importantly, customer satisfaction metrics improved simultaneously. Net Promoter Score increased 12 points, and “product as described” ratings rose from 4.1 to 4.6 stars. This demonstrates that reducing returns through better accuracy creates wins for both retailers and customers.
How To Implement Computer Vision for Returns Management?
Successful implementation requires systematic planning rather than ad-hoc technology adoption. Follow this framework to maximize ROI and minimize disruption.
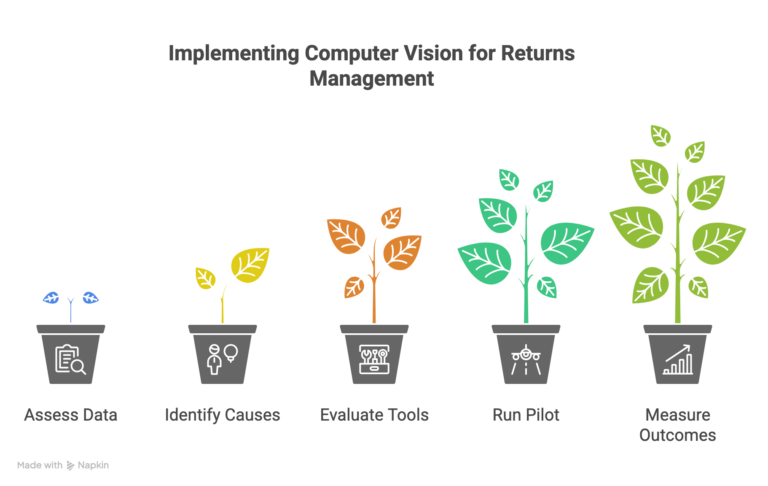
Step 1: Assess Your Current Returns Data
Begin with a comprehensive returns analysis. Mine your data for:
- Return rates by product category, SKU, vendor, and time period
- Primary return reasons (extracted from customer feedback and return codes)
- Processing costs per return (shipping, inspection, restocking, depreciation)
- Fraud indicators and patterns
Pro Tip: Most retailers discover that 20% of SKUs generate 60-70% of returns. Prioritizing these high-impact products accelerates ROI.
Quantify your baseline. If you’re processing 25,000 monthly returns at $15 average cost, that’s $375,000 monthly or $4.5 million annually. An 18% reduction represents $810,000 in annual savings—establishing your business case.
Step 2: Identify Top Return Causes That Computer Vision Can Address
Match your return reasons to visual AI capabilities:
- High-frequency sizing issues → Virtual try-on, 3D modeling, fit prediction
- Quality complaints → Pre-shipment inspection, defect detection
- Color/appearance mismatches → Enhanced product visualization, spectral imaging
- Fraud patterns → Return image analysis, authenticity verification
Not all return causes respond to computer vision. Policy-related returns (“changed my mind”), legitimate quality issues from manufacturing defects, or delivery damage require different interventions.
Warning: Avoid implementing visual AI for return categories that it cannot influence. This dilutes ROI calculations and creates unrealistic expectations.
Step 3: Evaluate Available Visual AI Tools and Vendors
The computer vision ROI retail landscape includes specialized vendors and platform solutions:
Specialized Solutions:
- Virtual try-on: Zugara, Fit Analytics, ELSE Corp
- Quality inspection: Landing AI, Cognex, Instrumental
- Fraud detection: Signifyd, Riskified, Forter
- AR visualization: Threekit, Vertebrae, ViewAR
Platform Approaches: Major cloud providers (AWS Rekognition, Google Cloud Vision, Azure Computer Vision) offer customizable frameworks requiring internal development resources.
Evaluation criteria should include:
- Integration complexity with the existing tech stack
- Training data requirements
- Accuracy benchmarks in your product categories
- Scalability to handle peak volume
- Total cost of ownership (licensing, implementation, maintenance)
Request pilot programs with 2-3 vendors using your actual product images and return data. Real-world testing reveals performance gaps that demos obscure.
Step 4: Run a Pilot with Top-Priority Products
Launch with a controlled test targeting your highest-return product categories. A 90-day pilot should include:
Week 1-2: Technical integration and system configuration
Week 3-6: Testing and refinement with a limited SKU set (50-100 products)
Week 7-12: Full pilot operation with performance monitoring
Track specific metrics:
- Return rate changes in pilot SKUs vs. the control group
- Customer engagement with visual AI features (usage rates, time spent)
- Operational impacts (processing time, inspection accuracy)
- Technical performance (system uptime, latency, error rates)
Pro Tip: Run an A/B test with matched product groups. Compare returns for items with computer vision implementation against similar products without it. This isolates technology impact from seasonal or market variables.
Step 5: Measure Outcomes and Adjust Your Approach
Analyze pilot results through multiple lenses:
Quantitative metrics:
- Absolute return rate reduction
- Cost per return prevented
- False positive rate (incorrectly flagged items)
- Customer satisfaction impact
Qualitative feedback:
- Customer comments about visual AI features
- Customer service team observations
- Warehouse operations input on quality screening
Based on findings, adjust algorithms, expand successful implementations, and refine struggling areas. Computer vision for returns is not “set and forget”; continuous improvement cycles optimize results over time.
What Are the Other Benefits?
Beyond direct return reduction, computer vision creates operational efficiencies and strategic advantages:
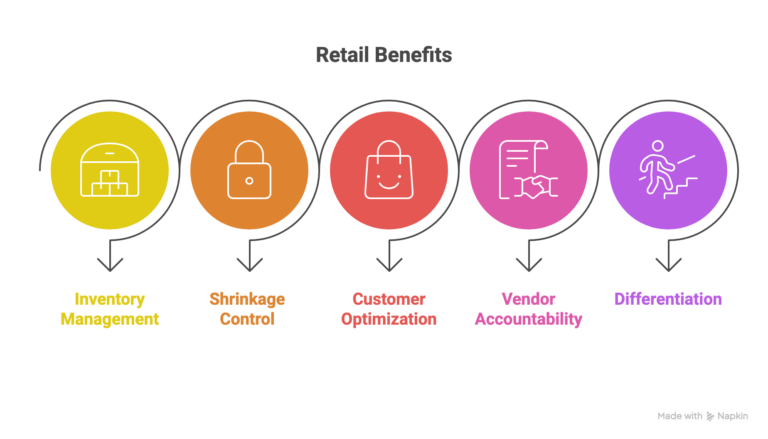
Enhanced Inventory Management: Better return predictions improve demand forecasting. When you know which items will likely return, you adjust purchasing and stocking strategies accordingly. This reduces overstock situations while maintaining availability.
Shrinkage Control: The same AI quality control systems deployed for return inspection deter internal theft and catch receiving errors. Retailers report 15-25% reductions in unexplained inventory shrinkage.
Customer Experience Optimization: Virtual try-on and AR visualization increase purchase confidence, reducing pre-purchase anxiety. This translates to higher conversion rates (typically 25-40% improvement) and larger average order values.
Vendor Accountability: Pattern recognition identifies systematic quality issues by supplier. Data-driven vendor conversations lead to improved manufacturing standards or supplier transitions based on objective performance metrics.
Competitive Differentiation: Visual AI capabilities become brand differentiators. In crowded e-commerce markets, superior product visualization and accurate representations build customer trust and loyalty.
These compound benefits often exceed the initial return reduction value. A complete cost-benefit analysis should capture both direct savings and these secondary impacts.
Conclusion
The retailers winning in e-commerce are those who leverage technology to solve operational challenges while enhancing customer experience. Computer vision for product returns delivers both, reducing costs while building trust through accuracy and transparency.
Don't let returns erode your margins in 2025.
Our computer vision specialists will review your returns data, identify high-impact opportunities, and provide a customized implementation roadmap with projected ROI. No obligation, just actionable insights to inform your decision.
FAQ
How long does it take to see ROI from computer vision for returns?
Quality control systems typically show results within 60-90 days. Customer-facing features like virtual try-on require 4-6 months as customers discover and adopt the tools. The case study retailer achieved break-even at month 7 and generated significant positive ROI by month 12.
Will this technology completely eliminate product returns?
No. Computer vision addresses information-gap returns but cannot prevent all return types. Legitimate quality issues, delivery damage, or preference-based returns will persist. Realistic expectation is 15-25% overall return reduction, not elimination.
How does computer vision handle new products without historical data?
Transfer learning allows models trained on similar products to generalize to new items. Performance improves as product-specific data accumulates. Most systems reach 85%+ accuracy within 30 days for new products in established categories.
What about customer privacy concerns with photo uploads?
Transparent privacy policies, explicit consent, and secure data handling address most concerns. Leading implementations use edge processing (analyzing images on-device without server upload) or immediate deletion after analysis. Customer education is key—clearly communicate how data is used and protected.


Related Articles