Greetings! I'm Aneesh Sreedharan, CEO of 2Hats Logic Solutions. At 2Hats Logic Solutions, we are dedicated to providing technical expertise and resolving your concerns in the world of technology. Our blog page serves as a resource where we share insights and experiences, offering valuable perspectives on your queries.

Quick Summary
Start Now: Begin aggregating and cleaning your data immediately. The dataset quality you build today determines your prediction accuracy in November.
Invest in the Right Tools: Whether building in-house capabilities or partnering with analytics platforms, ensure you have the infrastructure to collect, process, and act on predictive insights at scale.
Test and Iterate: Don’t wait for Black Friday to validate your models. Run smaller-scale tests during other promotional periods to refine your approach.
Embrace Automation: Manual analysis can’t keep pace with the speed and complexity of modern Black Friday campaigns. Automate data collection, model training, and tactical execution wherever possible.
Black Friday has evolved from a single-day shopping frenzy into a weeks-long commercial phenomenon that can make or break a retailer’s annual performance. The traditional approach of relying on gut instinct and last year’s numbers no longer cuts it in today’s hyper-competitive retail.
Data-driven strategies have become the cornerstone of successful Black Friday campaigns, enabling retailers to anticipate demand, optimize inventory, and personalize customer experiences with remarkable precision.
This shift toward predictive analytics isn’t just about having more data; it’s about transforming that data into actionable insights that drive revenue. Companies leveraging Black Friday sales prediction models consistently outperform their competitors, capturing market share while minimizing waste and maximizing profitability.
PRO TIP: Start preparing your data infrastructure at least 8-12 weeks before Black Friday. The quality of your predictions depends heavily on how well you’ve organized and cleaned your historical data.
Understanding Sales Prediction Through Data Analytics

How Predictive Analytics Enhances Retail and E-Commerce Performance
Predictive analytics for Black Friday goes far beyond simple trend analysis. It uses historical data, consumer behavior patterns, and advanced algorithms to accurately forecast future sales. By implementing data analytics methodologies, retailers can:
- Anticipate demand spikes for specific products or categories
- Optimize pricing strategies based on competitor behavior and price elasticity
- Reduce stockouts and overstock situations that erode profit margins
- Personalize marketing messages to individual customer segments
- Allocate marketing budgets more efficiently across channels
Machine Learning Models Commonly Used for Forecasting Black Friday Sales
The foundation of effective Black Friday sales prediction lies in selecting the right machine learning for sales algorithms. Here are the most powerful approaches:
Linear Regression Models: These serve as baseline models, establishing relationships between variables like past sales, marketing spend, and seasonal factors. While simple, they provide valuable insights into core trends.
Random Forest Algorithms: By creating multiple decision trees and aggregating their predictions, Random Forest models excel at handling complex, non-linear relationships in retail data. They’re particularly effective for capturing the unpredictable nature of consumer behavior during Black Friday.
Gradient Boosting Machines (XGBoost, LightGBM): These advanced ensemble methods iteratively improve predictions by focusing on previously misclassified data points. They’re the gold standard for trend forecasting in e-commerce, often delivering the most accurate results.
Time Series Models (ARIMA, Prophet): Essential for capturing seasonal patterns and temporal dependencies, these models understand that Black Friday 2025 sales will be influenced by multi-year trends, not just last year’s performance.
WARNING: Don’t fall into the trap of over-relying on a single model. The best approach combines multiple algorithms in an ensemble method, leveraging the strengths of each to produce more robust predictions.
Need help turning your customer and market data into actionable Black Friday insights?
Key Data Sources for Accurate Sales Prediction
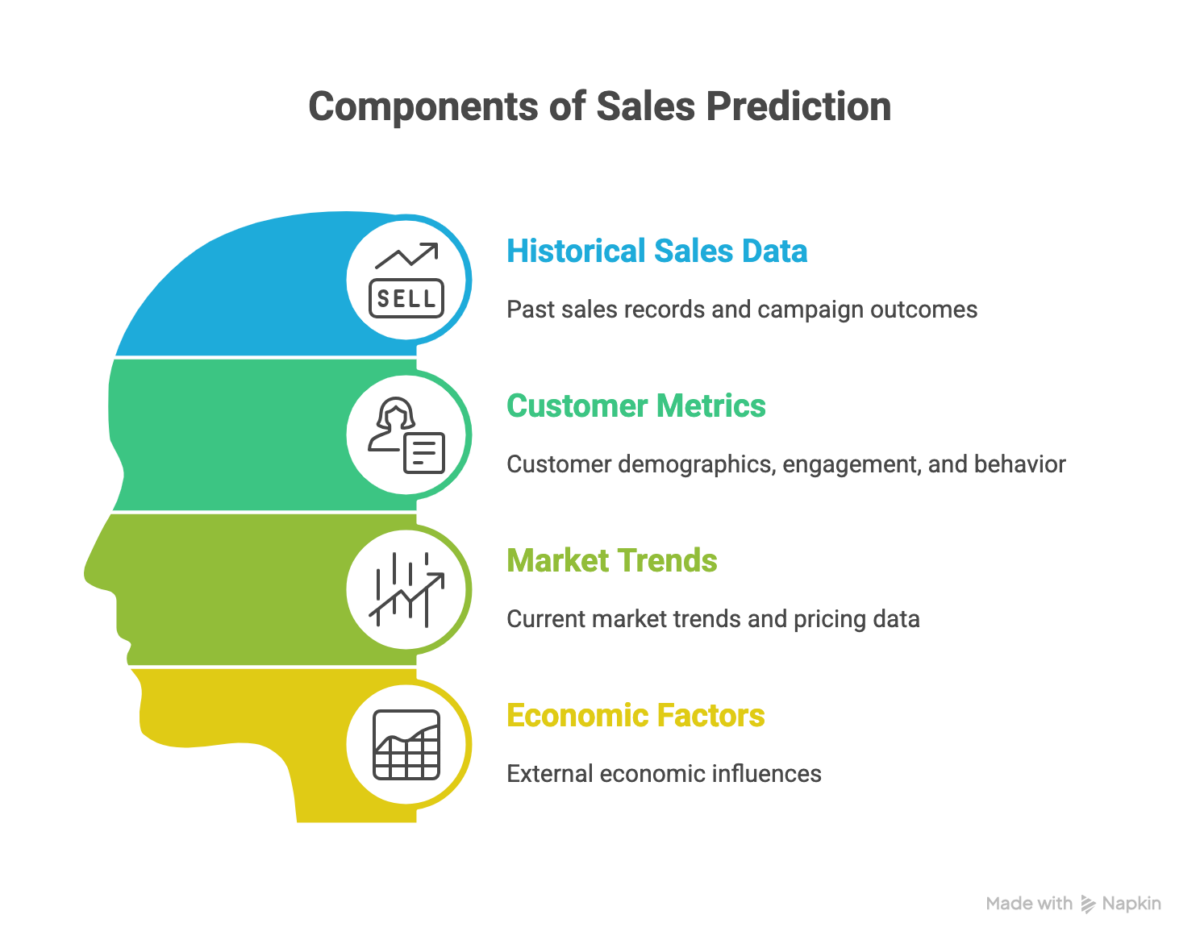
Historical Sales and Campaign Performance Data
Your most valuable asset for forecasting Black Friday demand is your own historical data. This includes:
- Transaction records from previous Black Fridays (ideally 3-5 years)
- Product-level performance metrics showing which items drove the most revenue
- Hourly sales patterns reveal peak shopping times
- Campaign performance data correlating marketing efforts with sales outcomes
- Discount effectiveness tracking, which promotions generated the highest ROI
Customer Demographics, Engagement, and Behavioral Metrics
Understanding who buys during Black Friday is as important as knowing what they buy. Critical consumer behavior analysis data includes:
- Demographic information: age, location, income brackets
- Purchase history: frequency, average order value, product preferences
- Engagement metrics: email open rates, website visits, time on site
- Cart abandonment patterns: what products get added but not purchased
- Channel preferences: mobile vs. desktop, app vs. web
- Loyalty program data: repeat customer behavior and lifetime value
Market Trends, Pricing Data, and External Economic Factors
Your predictions must account for the broader economic landscape:
- Competitor pricing intelligence: tracking price movements across your competitive set
- Economic indicators: consumer confidence index, unemployment rates, inflation data
- Search trend data: Google Trends showing rising interest in product categories
- Social media sentiment: analyzing buzz around Black Friday deals
- Supply chain indicators: potential constraints that might affect inventory availability
PRO TIP: Use web scraping tools and competitive intelligence platforms to monitor competitor pricing in real-time. Price gaps of just 5-10% can significantly impact conversion rates during Black Friday.
Data Preparation and Model Building
Cleaning, Structuring, and Merging Datasets
Raw data is messy. Before building your predictive analytics model, you must:
Data Cleaning Steps:
- Remove duplicates and correct obvious errors in transaction records
- Handle missing values through imputation or intelligent deletion
- Normalize data formats across different sources (date formats, currency, product IDs)
- Identify and treat outliers that could skew your predictions
- Encode categorical variables (product categories, customer segments) for model compatibility
Data Structuring: Organize your data into a unified format where each row represents a potential prediction unit (e.g., product-day combination) with columns for:
- Historical sales figures
- Product attributes (price, category, brand)
- Marketing features (promotions, ad spend, email campaigns)
- Temporal features (day of week, week of year, days until Black Friday)
- Customer features (aggregated demographics, behavioral scores)
Feature Selection and Model Training
Using data analytics for retail success requires identifying which variables actually influence Black Friday sales. Key feature engineering techniques include:
Temporal Features:
- Days/weeks until Black Friday
- Day of week effects
- Previous Black Friday performance (lagged features)
- Running averages of recent sales
Product Features:
- Historical sales velocity
- Price positioning vs. competitors
- Discount depth
- Inventory levels
- Product age and lifecycle stage
Customer Features:
- Customer lifetime value scores
- Segmentation clusters (bargain hunters, quality seekers, etc.)
Model Training Process:
- Split your data into training (70%), validation (15%), and test sets (15%)
- Train multiple algorithms on the training set
- Tune hyperparameters using the validation set
- Evaluate final performance on the test set you haven’t touched yet
WARNING: A common mistake is training your model on data that includes Black Friday week, then testing it on the same period. This creates data leakage and unrealistic accuracy estimates. Always ensure strict temporal separation between training and test data.
Evaluating Model Accuracy
For Black Friday sales prediction, focus on these metrics:
Root Mean Squared Error (RMSE): Penalizes large prediction errors more heavily. Critical for avoiding catastrophic stockouts or massive overstock situations.
Mean Absolute Error (MAE): Gives you an intuitive sense of average prediction error in actual units (e.g., “we’re off by an average of 50 units per product”).
Mean Absolute Percentage Error (MAPE): Helps you understand relative accuracy. A MAPE of 15% means your predictions are typically within 15% of actual sales, acceptable for many retail applications.
R-squared: Indicates how much of the sales variance your model explains. Aim for R² > 0.70 for reliable data-driven Black Friday marketing decisions.
Applying Predictive Insights to E-Commerce Strategy
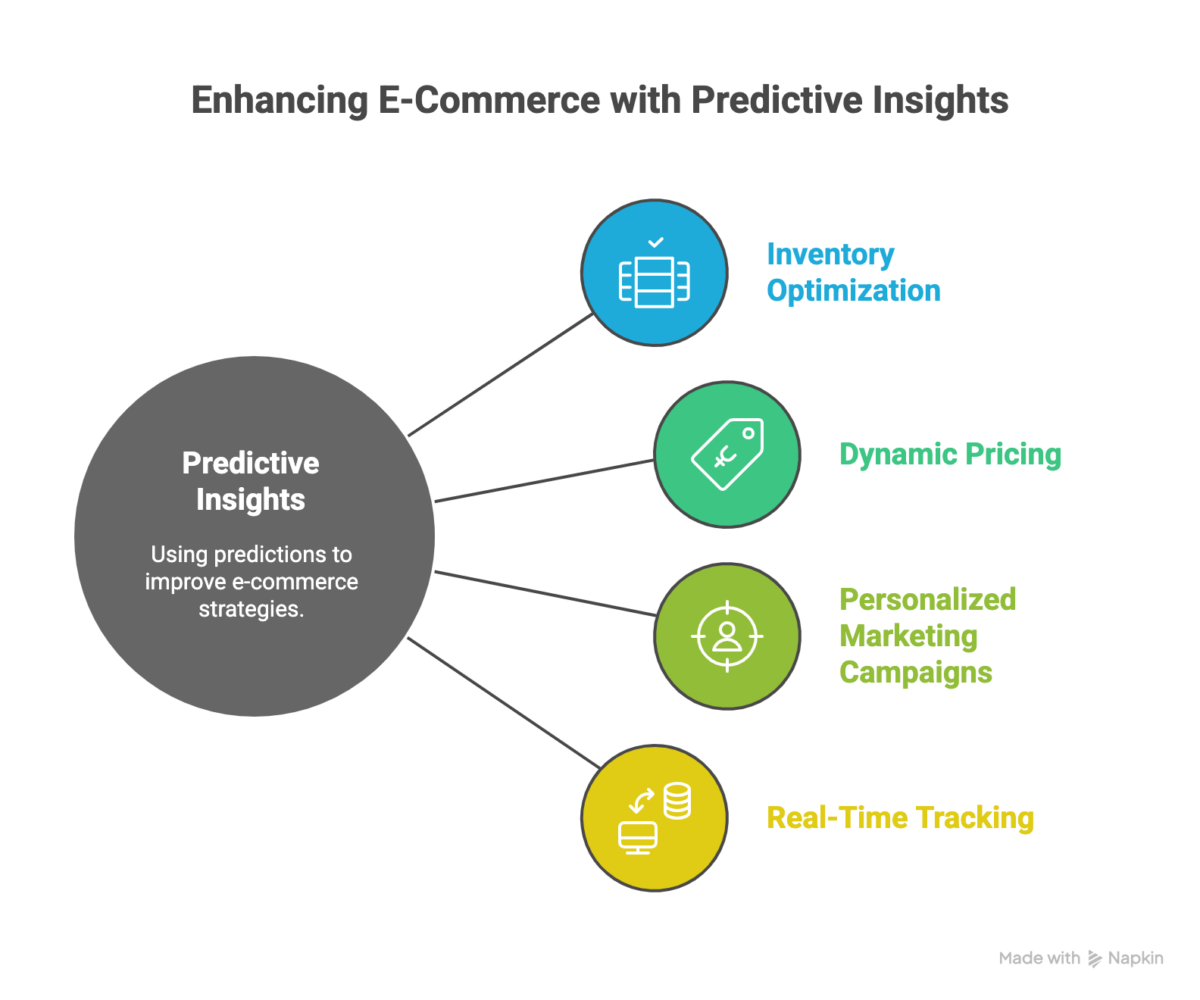
Using Predictions for Inventory Optimization and Dynamic Pricing
Once you’ve built reliable Black Friday trends 2025 forecasts, the real work begins, operationalizing these insights:
Inventory Optimization:
- Pre-position stock at fulfillment centers closest to predicted demand hotspots
- Adjust safety stock levels based on prediction confidence intervals
- Prioritize production or supplier orders for high-demand items
- Plan warehouse staffing according to predicted order volumes by hour and day
Dynamic Pricing Strategies:
- Implement competitive repricing that responds to real-time market conditions
- Test price elasticity predictions with controlled A/B tests before Black Friday
- Schedule promotional discounts to maximize revenue, not just volume
- Reserve limited inventory for higher-margin sales channels
PRO TIP: Build your pricing algorithms with floor prices that protect profit margins. During the heat of Black Friday, automatic repricing can spiral into unprofitable territory without proper guardrails.
Personalizing Marketing Campaigns Using Customer Segmentation
Consumer behavior analysis reveals distinct customer archetypes that respond to different messaging:
Bargain Hunters:
- Emphasize discount percentages and savings amounts
- Use urgent, scarcity-driven language (“Limited quantities!”)
- Target with flash sales and doorbusters
Quality Seekers:
- Highlight premium features and long-term value
- Use customer reviews and expert endorsements
- Offer extended warranties or white-glove services
Convenience Shoppers:
- Promote easy returns, fast shipping, and curbside pickup
- Emphasize time-saving benefits
- Target with one-click purchasing options
Gift Buyers:
- Focus on gift-wrapping, gift guides, and curated collections
- Highlight items appropriate for various recipients
- Offer gift cards and registry options
Real-Time Tracking to Adjust Offers Based on Live Consumer Data
The most sophisticated e-commerce marketing operations don’t just predict, they adapt:
Real-Time Monitoring Dashboards: Create live dashboards tracking:
- Actual vs. predicted sales by product and category
- Traffic sources and conversion rates
- Cart abandonment rates
- Inventory depletion rates
- Promotional code usage
- Competitive pricing changes
Automated Response Protocols:
- If a product is selling faster than predicted, increase the price slightly, reduce the discount depth, or extend the promotion
- If sales lag predictions: amplify marketing, increase discount, or bundle with popular items
- If competitors drop prices dramatically, trigger repricing algorithms within pre-set margin boundaries
WARNING: Real-time changes can confuse customers and damage brand perception. Avoid frequent price fluctuations on the same item. Instead, adjust inventory allocation, marketing spend, or promotional placement.
Observed Trends and Practical Benefits in E-Commerce Campaigns
Recent Black Friday trends 2025 data reveal several critical patterns:
Mobile Dominance Continues: Over 70% of Black Friday traffic now originates from mobile devices. Retailers who optimized for mobile checkout saw 35% higher conversion rates than those with clunky mobile experiences.
Extended Shopping Windows: The “Black Friday weekend” has stretched into “Black November.” Predictive models now need to account for deal-seeking behavior throughout the month, with distinct peaks on specific days.
Personalization Wins: Generic mass promotions underperform targeted, personalized offers by 3-5x. Retailers using customer segmentation in their data-driven Black Friday marketing consistently achieve higher ROI.
Sustainability Concerns: An emerging segment of consumers actively seeks brands with transparent supply chains and sustainable practices, even during discount periods. Forward-looking prediction models now incorporate ESG scoring as a variable.
PRO TIP: Study your competitors’ Black Friday strategies from previous years. They’ve already run expensive experiments that you can learn from. Look for patterns in their timing, discount structures, and promotional channels.
Conclusion
The true value of using data analytics for retail success extends far beyond a single shopping event. Organizations that build mature predictive capabilities see compounding benefits:
- Reduced forecasting errors across all seasonal events, not just Black Friday
- Improved supplier relationships through accurate demand signals
- Enhanced customer loyalty driven by personalized experiences
- Operational efficiency gains from optimized inventory and staffing
- Competitive intelligence that informs strategic decisions year-round
The retailers winning Black Friday in 2025 won’t be those with the deepest discounts; they’ll be those with the smartest use of their data. Every transaction, click, and cart abandonment is a signal. The question is: are you listening?
Ready to transform your Black Friday performance with predictive analytics?


Related Articles